Monday, November 24, 2014

Google Analytics vs. Clicky Web Analytics: Who Reigns Supreme?


Clicky is a complete web analytics tool that allows analysts to collect web traffic data. It combines data reporting with real-time website monitoring in a comprehensive way that allows analysts to retrieve data at the drop of a hat. Clicky’s dashboard contains all web traffic information so users do not have to do much researching into the analytics software to find the data they are looking for. Also, Clicky understands analysts are interested in the data generated from today and the reports display this data by default.


Now that we have the basics down let’s move on to the fun stuff: comparing and contrasting against its rival – Google Analytics.
 Clicky has two super cool features that one wouldn’t find on Google Analytics. One, the spy feature allows users to see who is currently on their website. It also allows users to monitor any trends in real-time. Clicky shows users each individual visitor and the actions they take on their site. This allows to understand what visitors from various demographics find appealing on their site. Google Analytics does not have this feature and Clicky beats out the GA software on tracking visitors. Two, Clicky has heat-mapping capabilities, which give users a holistic view of what visitors are doing and shows data such as where visitors are clicking on pages, and can be segmented by goal or visitor sessions. Google Analytics does not have either features.

One feature both software tools have are bounce rate measurements. However, bounce rates are measured differently by Google Analytics and Clicky. GA provides the bounce rate percentage using a formula that tracks visitors who only visits one page of a website and leaves. It does not account for the amount of time that a visitor may have spent browsing that one page. Clicky does. According to Clicky.com, “a visitor will only count as a bounce on Clicky if they only view a single page and they were on your web site for less than 30 seconds. We figure, if someone is there for at least 30 seconds, they were at least mildly engaged and should not count as a bounce” (Clicky, n.d.).

The dwell time should be taken into account when monitoring the bounce rate for a site, specifically because a visitor could have spent 5 full minutes reading and extracting information from one page. According to this infographic, most content websites will have a bounce rate between 40 – 60%. Clicky understands the factors that can affect a site’s bounce rate and has created software that caters to understanding that a visitor’s dwell time should be taken into consideration before creating a bounce rate percentage.

In addition to bounce rate measurement, Google Analytics doesn’t measure the time spend on a site correctly. Instead, Google measures time spent on a site by the next page view. For instance, if a visitor were to only view one page, regardless of how long he/she spent time on that specific page, Google Analytics will classify it as a 0 second visit. Furthermore, “if a user visits Page A and then Page B and then leaves, the entire duration of his time spent on Page B will be written off as 0 seconds too.  This is why Analytics users see so many visitors reported under the “0-10s” time duration” (Grunwerg, 2013). Google does address this and according to Google: “When a page is the last page in a session, there is no way to calculate the time spent on it because there is no subsequent pageview. For this reason, when Page A is the last page in the visitor’s session, its time calculation is not counted for that view. In addition, when that page is the only page viewed in the session, no time on page is calculated” (Google, n.d.b.). Clicky, however, measures a session different. It uses pingback to check if a visitor is still present on a site and reports the time spent on the site to the analytics.

Tyler King of Less Annoying CRM reviewed Clicky’s software and compared against Google Analytics. He stated: “Clicky's user interface could use some work.  Everything is fine from a functional standpoint, but sometimes the data isn't displayed in an intuitive way.  There are also a lot of places where the text isn't context aware.  For example, there were a number of places that reference how my actions might impact other sites on my account, but I only have one site so I was kind of confused” (King, 2010). The interface on Google Analytics is more user-friendly for an in-depth analysis.


Clicky seems to be more fitting for businesses that are serious about tracking their online presence. The analytics tool also has Video and Twitter Analytics. For businesses that are using videos to attract viewers, Clicky has a feature that tracks how long viewers watch a video, when a viewer pauses a video and more. A benefit of this feature is it gives businesses an idea of where viewers are pausing or skipping certain content in a video; resulting in giving an idea of if viewers are uninterested in the content or if there is a blip in the video. Clicky also monitors Twitter mentions, meaning a business can monitor what Twitter users are tweeting about a brand or product and have a clear idea of how it is affecting social media presence. This feature is helpful for businesses utilize Twitter to create dialogue with users or use the social platform to respond to questions or complaints.

There are many benefits of using Google Analytics and Clicky Analytics. However, it depends on the needs of your business or user preferences that determines which analytic tool is right for you. Which tool do you prefer to use and why?


References

Clicky. (n.d.a.). Clicky website information. Retrieved 2014, November 24 from http://clicky.com/

Google. (n.d.b.). Google website information. Retrieved 2014, November 24 from http://www.google.com/analytics/

Grunwerg, A. (2013, May 22). Clicky vs analytics – why google analytics reporting is flawed. Retrieved from http://www.searchable.co.uk/clicky-vs-analytics-why-google-analytics-reporting-is-flawed/

King, T. (2010, May 14). Clicky web analytics review. Retrieved from https://www.lessannoyingcrm.com/blog/2010/05/81/Clicky+Web+Analytics+Review


Monday, November 10, 2014

Social Media and Marketing: Which Platform is Right for You?


With all the social media sites available to the marketer today, it can be hard to figure which ones to leverage. For large companies, one may decide to utilize all the popular platforms like Facebook, Twitter, YouTube, and Pinterest. For small businesses, it would be time-consuming and expensive to keep up with every single outlet.

So, which social media platform would you pick?

The answer isn’t as simple as one would think. Marketers have to choose the platforms that best fit their demographic target audience(s) and determine which platform best fits the company. Let’s break it down using Twitter, LinkedIn, and Facebook.

Twitter and LinkedIn are great platforms for marketers of publications and B2B businesses. Lead generation is a top priority for marketers and also poses a challenge for influencing consumer behavior. “Twitter users who see Tweets from B2B tech brands are more likely to visit the sites of these brands. [A] study found that Twitter users visit B2B tech brand sites at a higher rate (59%) compared to average Internet users (40%), illustrating the strong presence of a B2B audience on Twitter” (Saito, 2013). LinkedIn is a platform that B2B service providers can use to attract consumers. For instance, recruiting companies looking for potential candidates for employment would find this to be a useful outlet. LinkedIn also gives marketers a change to generate leads and influence the sharing of content with Twitter users. Both sites are desirable for marketers that are interested in increasing traffic and brand consideration.

Facebook is as social media platform that has many different uses. According to a study on Social Bakers, businesses with visually driven products would find this site helpful as photos and images account for 93% of the most engaging posts on Facebook. Only 2% of the most engaging content on Facebook is generated by links, another 2% by videos, and 3% by status updates (Social Baker, 2013). For instance, a company like Nikon would find Facebook to be beneficial since the brand attracts consumers by the quality of their cameras and the best way to attract potential customers is by posting photographs taken by their product line. B2C marketers would also find Facebook a great platform to display coupons and discounts since 92 % of B2C marketers use Facebook and find it easy to tailor content by profiling users through demographic, personalize preferences, and more (Lyle, 2013)


With so many social media platforms available, it is easy to choose one that does not fit the demographic marketers are trying to reach. For instance, say you wanted to market to men between the ages of 18 – 35 and the product is deodorant. “Pinterest shoppers are spending significantly more per checkout averaging between $140-$180 per order compared with consistent $80 and $60 orders for Facebook and Twitter shoppers, respectively” (Abramovich, 2013). However, Pinterest would be the least effective platform as Pinterest hosts a demographic majority of women. “80% of Pinterest users are female and female users are far more active than male users with 92% of all pins created by women. In fact male use of Pinterest has been consistently declining since July 2011. 13% of pins in July 2011 were made by men, currently that percentage stands at 6%. Conversely, the total activity of female users has grown from 87% to 94% over the past three years” (Ratcliff, 2013). As a result, Pinterest would not be the platform to allocate Axe’s marketing efforts as the social media site would be better suited for brands whose target audience is moms.


Another thing to consider when choosing platforms for a business: content vs. conversation. “Content marketing is a marketing technique of creating and distributing valuable, relevant and consistent content to attract and acquire a clearly defined audience – with the objective of driving profitable customer action” (CMI, n.d.). When it comes down to it, content without conversation is just advertising. The message is broadcasted to the viewer and the information does not go beyond that point. If a marketer or brand is lucky, the viewer may react to the information that was given. Conversation, on the other hand, is what gives the message its meaning. Let’s use Johnson & Johnson as an example, again. If the company were to post on Facebook:

“A single solution to sensitive skin (link to J&J website here)”  


This post would expose Facebook fans to the new product, but it does not give consumers a reason to embed the message in their conscious, respond, “like”, or share the post with others. However, if Johnson & Johnson were to take the same product and use a post such as:


Have you tried our new Johnson & Johnson sensitive baby bath? Take a look here (insert embedded link) and tell us what you think!

This post stirs up the fun. It gives users a chance to respond with their own stories and experiences, exposes potential customers to the new product, and creates dialogue and community with the brand’s following.  


Before creating content companies should evaluate their marketing plans to understand their goals and target demographics. Any information posted on social media platforms should be engaging and keep users coming back to company pages. Content posted by marketers should stand out from competitors and cater to the consumer. It is important to have a strategy in place to create strong content that will draw the attention of social media users and keep them interested until a brand connection can be established. Quality content is critical for any marketing campaign, and can spark conversation when done correctly. Here are some tips from Carrie Swain on utilizing content:

·         Keep it simple and don’t over think it

·         High quality content is content that others find interesting, engaging, educational or funny.

·         Don’t stop creating, create a content schedule

·         Include SEO from the beginning. Integrating good SEO into your content is a must

·         Engage fans and your audience

·         Create awareness

·         Think outside the box and don’t be afraid to stand out (Swain, 2013).


Regardless of how small or large a brand is, it is important to utilize more than one social media outlet to establish the brand on different platforms. It is equally important to choose the correct social media platforms that will attract the target market desired and create a sense of community with the brand and its followers. Content and conversation are also key factors in any marketing effort that utilizes social media sites.


References

Abramovich, G. (2013, May 4). 15 stats retailers should know about pinterest. Retrieved from http://digiday.com/brands/15-stats-retailers-should-know-about-pinterest/

CMI. (n.d.). What is content marketing. Retrieved 2014, November 9 from http://contentmarketinginstitute.com/what-is-content-marketing/

Lyle, C. (2013, July 12). 8 stats every b2c content marketer should know. Retrieved from http://bostinno.streetwise.co/channels/8-stats-every-b2c-content-marketer-should-know/

Ratcliff, C. (2014, May 12). 84% of female pinterest users are still active in their fourth year. Retrieved from https://econsultancy.com/blog/64821-84-of-female-pinterest-users-are-still-active-in-their-fourth-year-stats#i.ns63m0f5hf9zu0

Saito, C. (2013, March 8). Twitter and compete study: how tweets influence b2b tech audiences. Retrieved from https://blog.twitter.com/2013/twitter-and-compete-study-how-tweets-influence-b2b-tech-audiences  

Social Baker. (2013). Photos make up 93 of the most engaging posts on facebook. Retrieved from http://www.socialbakers.com/blog/1749-photos-make-up-93-of-the-most-engaging-posts-on-facebook

Swain, C. (2013, February 3). Content vs conversation in social media. Retrieved from http://www.carrienagy.net/content-vs-conversation-in-social-media/

Monday, November 3, 2014

What's Pageviews Got To Do With It?


Have you wondered how many times a single visitor has viewed your page? Maybe you’ve had 100 visits today – was your website viewed by 100 different people? 75 different people? Maybe only one person viewed your site 100 times. While I hope it isn’t the latter, let’s take a look at how one metric measures up in web analytics: pageviews.

According to the Web Analysis Association, page views is defined as the number of times a page was viewed (Web Analysis Association, 2006). Digging a little deeper, this means you can define the type of file, module, PDF, and others as a page and when a user views each, they can be counted as pageviews”

Here’s an example using Google as our model.


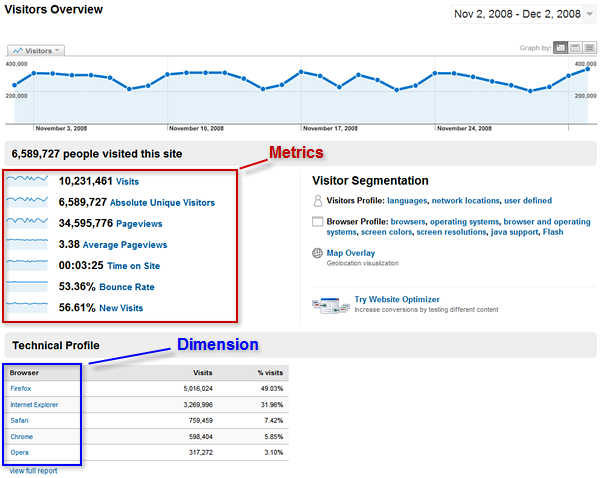
You can see Google has 34,595,776 pageviews. If you were to visit Google’s homepage and its ‘about’ page today, that would count as one visit and two pageviews.

According to Sports Marketing LLC, “generally speaking, you want each visitor to look at as many pages on your site as possible. Depending on the type of website you have, the type of advertising you do, and the type of visitor you have, the average number of pageviews per visitor can range from [a low number] to as many as 40 pages per visit for a site like Craigslist. Google has a benchmarking service that allows you to compare your site to similar sites by industry” (Sports Marketing LLC, 2009).

Though tracking page views is an analytics tool some businesses will find helpful, pageviews can fall short as they do not measure how engaged the users that view your website actually are. There are many variables at play when measuring engagement, and there are many ways to define and track it. Taking pageviews at face value can mislead marketers relying on the metric to analyze their data. The question to ask is: did the visitors view different pages within the website because they were interested in the content on each page or were they browsing the site because they could not find what they were looking for?

It can be difficult to determine how beneficial pageviews can be to a business. “Pageviews are often taken to advertisers as proof of a campaign's performance but pageviews offer no insight into the quality of content, or the impact it may have had on a reader” (Reid, 2014). However, there are benefits to using pageviews as a metric.

Doubling Your Pageviews

What if you wanted to attract more viewers to your personal or business blog? How can you do this? Utilizing the more tag sparks curiosity and grasps the viewers’ attention, thus increasing your change of gaining more pageviews. A post on Blogussion.com states:

[There] is a very exciting benefit to the more tag. Say for instance someone found your blog through Google and was sitting on your homepage reading the excerpt to your latest post. That’s one view. They are interested, and they visit the next page to read the full post. There’s one more. So by using the more tag, you will likely get two pageviews per person when they visit your blog and get interested. Add that up over time when more people do it, and you can get thousands of hits with less people (Blogussion, n.d.).

All in all, pageviews have its pros and cons – ultimately it depends on you whether or not it is a good metric for you to utilize in gaining and understanding the analytic data of your website.


Batra, A. (2009, June 18). Hits, page views, visitors, and visits demystified. Retrieved from http://webanalysis.blogspot.com/2009/06/hits-page-views-visitors-and-visits.html#axzz3I3iMDKed

Blogussion. (n.d.). Double your page views – pros and cons of displaying partial posts. Retrieved 2014, November 3 from http://www.blogussion.com/favorites/increase-pageviews-partial-posts/

Reid, A. (2014, May 3). What are the alternatives to pageviews? Retrieved from  http://www.journalism.co.uk/news/measuring-the-news-what-are-the-alternatives-to-pageviews-/s2/a556640/

Sports Marketing LLC. (2009, September 29). What are visits, visitors, and page views? google analytics for beginners. Retrieved from http://sporkmarketing.com/376/what-are-visitors-unique-visitors-and-page-views-google-analytics/


Web Analysis Association. (2006). Web analytics the big thee definitions. Retrieved from http://www.digitalanalyticsassociation.org/Files/PDF_standards/WebAnalyticsDefinitionsBig3.pdf


Learning From Your Bounce Rate


In web analytics, there are key components in which you can analyze your website’s data, and your bounce rate should be among the data you analyze. According to the Web Analytics Association, a bounce Rate is the percentage of single page visits divided by entry pages (WAA, 2007). Bounce rate is determined by the percentage of visitors who visit a website and leave without viewing any other pages on the website. “If you look into your Google Analytics, you will see a percentage. If you’re average bounce rate, for example, is 75%, this means that 75% of the people who come to your website leave after only viewing the page they entered on, whether it was your homepage or an internal page” (Hines, 2011).

There are many factors that can contribute to a site’s bounce rate. Instances include:
·         Viewers leaving the site due to navigation issues.
·         Viewers finding the information they need after viewing one page of site
·         Viewers not finding what they need or having no interest after navigating a single page

So, why do you have a high bounce rate?
Let’s take a look, shall we? Here are several factors that can cause a high bounce rate.

Pop-ups – Though pop-ups can increase the amount sign-ups to mailing lists and more, most people find them extremely annoying to navigate through. You have to test and time pop-ups well so users do not click the tiny X at the top of their screen.

Poor Design – Viewers with an untrained eye can determine if a site has a poor design or not. It’s easy to tell if a site is appealing or not. Don’t believe me? Which would you browse?


Your choice of color and design aren’t the only things that may affect your bounce rate; usability is also an issue.

Usability – Cluttered sites give users no desire to stick around. It is hard to get users to stay on a site they have difficulty navigating around. There are three basic rules you can follow to allow for easy navigation:
  • Website visitors expect certain things to be in certain places, stick to conventions (like navigation across the top of the site) in most cases.
  • Every square inch of your website doesn’t need to contain something, whitespace is your friend.
  • Above all else, users should be able to determine what you do and what you offer within a few seconds of reaching any page on your site (Hall, 2012).

It is important to have monitor user behavior if your bounce rate is high. For instance, a user bookmarking a single page off your site and then leaving should be observed as this is still considered a bounce. So, how can you improve your bounce rate? The design of your site and your analytics application can affect your bounce rate. Improving your bounce rate will require specific changes to your site.

It is also important to analyze your data. “A general site-wide bounce rate can vary too much due to the different marketing activities that run concurrently. Consider your bounce rate for specific traffic sources. Using other dimensions, like medium, campaign, landing page, to evaluate your bounce rate can also be more actionable than your general bounce rate” (Google, n.d.).

You can also improve your bounce rate by adding links to your page, adding links to the content in your sidebar, and refining your content so users will stick around and enjoy your site. Making the necessary changes will lower your bounce rate and don’t forget to link your social media pages to your website. You can always attract more users to your site and give them a way to stay in contact with you!


References

Hall, S. (2012, December 2). Reasons your bounce rate is high (and how to lower it). Retrieved from http://blog.crazyegg.com/2012/10/02/reasons-bounce-rate-is-high/

Hines, K. (2011, November 1). What you can learn from bounce rate & how you can improve it. Retrieved from https://blog.kissmetrics.com/what-you-can-learn-from-bounce-rate-how-to-improve-it/

WAA. (2007, August 16). Web Analytics Definitions. Washington, DC.